User guide#
Graphical User Interface (GUI)#
The GUI is designed to visualize and interact with time series data stored in pynapple objects. It provides a user-friendly interface to explore the data.
To launch the GUI, you can use the scope function from the pynaviz package. This function takes a dictionary of pynapple objects and opens the GUI.
import pynapple as nap
import numpy as np
from pynaviz import scope
# Create some example data
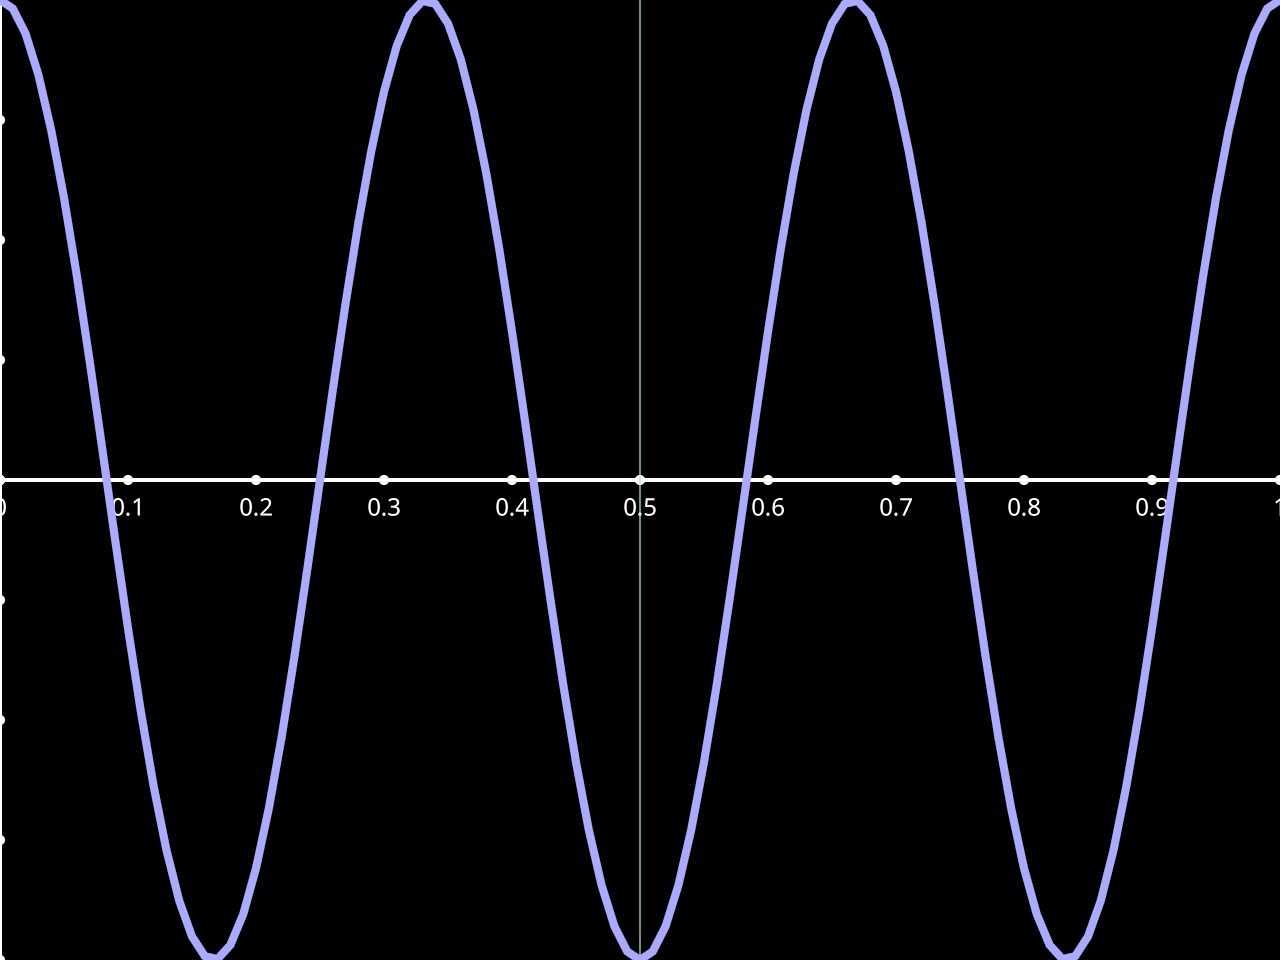
tsd = nap.Tsd(t=np.arange(1000), d=np.sin(np.arange(1000) * 0.1))
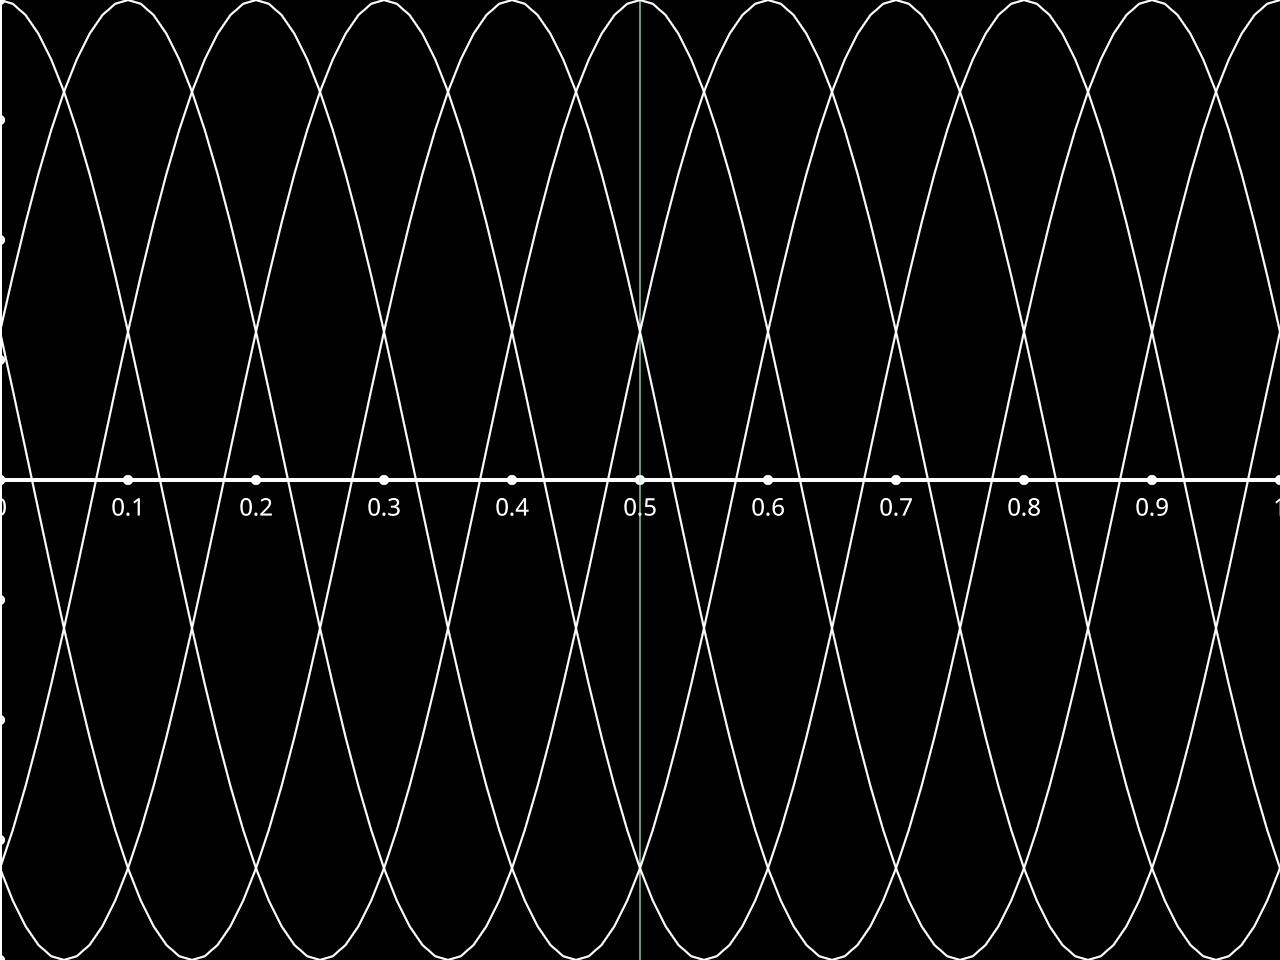
tsdframe = nap.TsdFrame(
t=np.arange(1000),
d=np.stack((
np.cos(2 * np.pi * np.arange(0, 100, 0.1)),
np.sin(2 * np.pi * np.arange(0, 100, 0.1))
)).T,
metadata={"label": np.random.randn(2)}
)
# Launch the GUI
scope({"tsd": tsd, "tsdframe": tsdframe})
You can also pass a path to a video file to visualize it alongside the time series data.
scope({"tsd": tsd, "video": "path_to_video.mp4"})
The GUI supports various pynapple objects, including Tsd, TsdFrame, TsGroup, IntervalSet, Ts, and TsdTensor. Each object type has its own visualization and interaction capabilities.
It also support reading NWB files.
scope("path_to_file.nwb")
To visualize NWB files and videos together, you can pass them together in a dictionary or a list.
scope({"nwb": "path_to_file.nwb", "video": "path_to_video.mp4"})
or
scope(["path_to_file.nwb", "path_to_video.mp4"])
Layout of the GUI can be saved. To reload a saved layout, you can pass the path to the layout file using the layout parameter.
scope({"tsd": tsd, "tsdframe": tsdframe}, layout_path="path_to_layout.json")
The same can be done at the shell level using the pynaviz command.
$ pynaviz path_to_file.nwb --layout_path path_to_layout.json
With multiples files:
$ pynaviz path_to_file.nwb path_to_video.mp4 --layout_path path_to_layout.json
Simple visuals#
Each pynapple object is mapped into a simple visuals using pygfx.
Tsd
TsdFrame
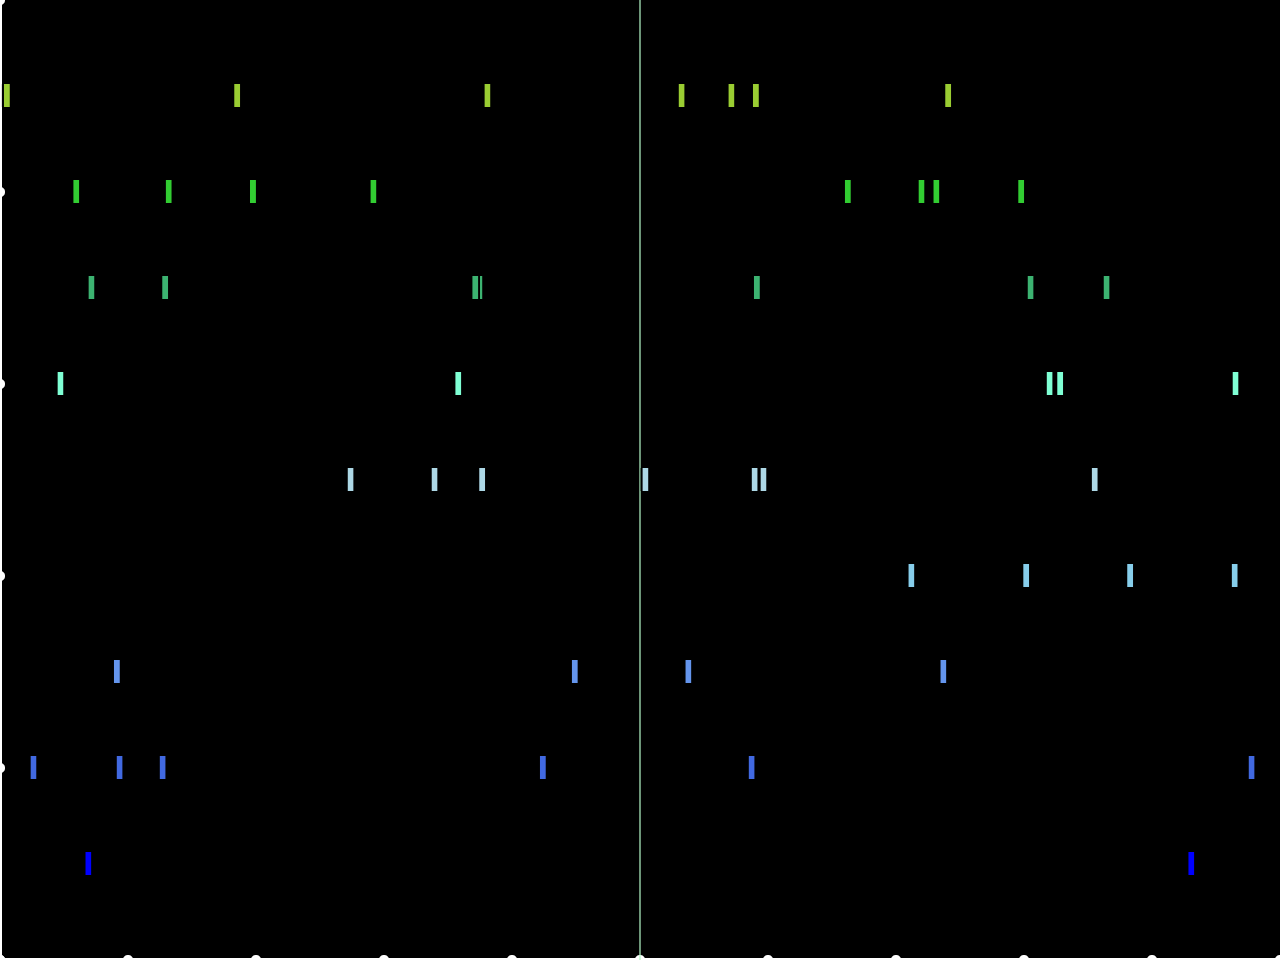
TsGroup
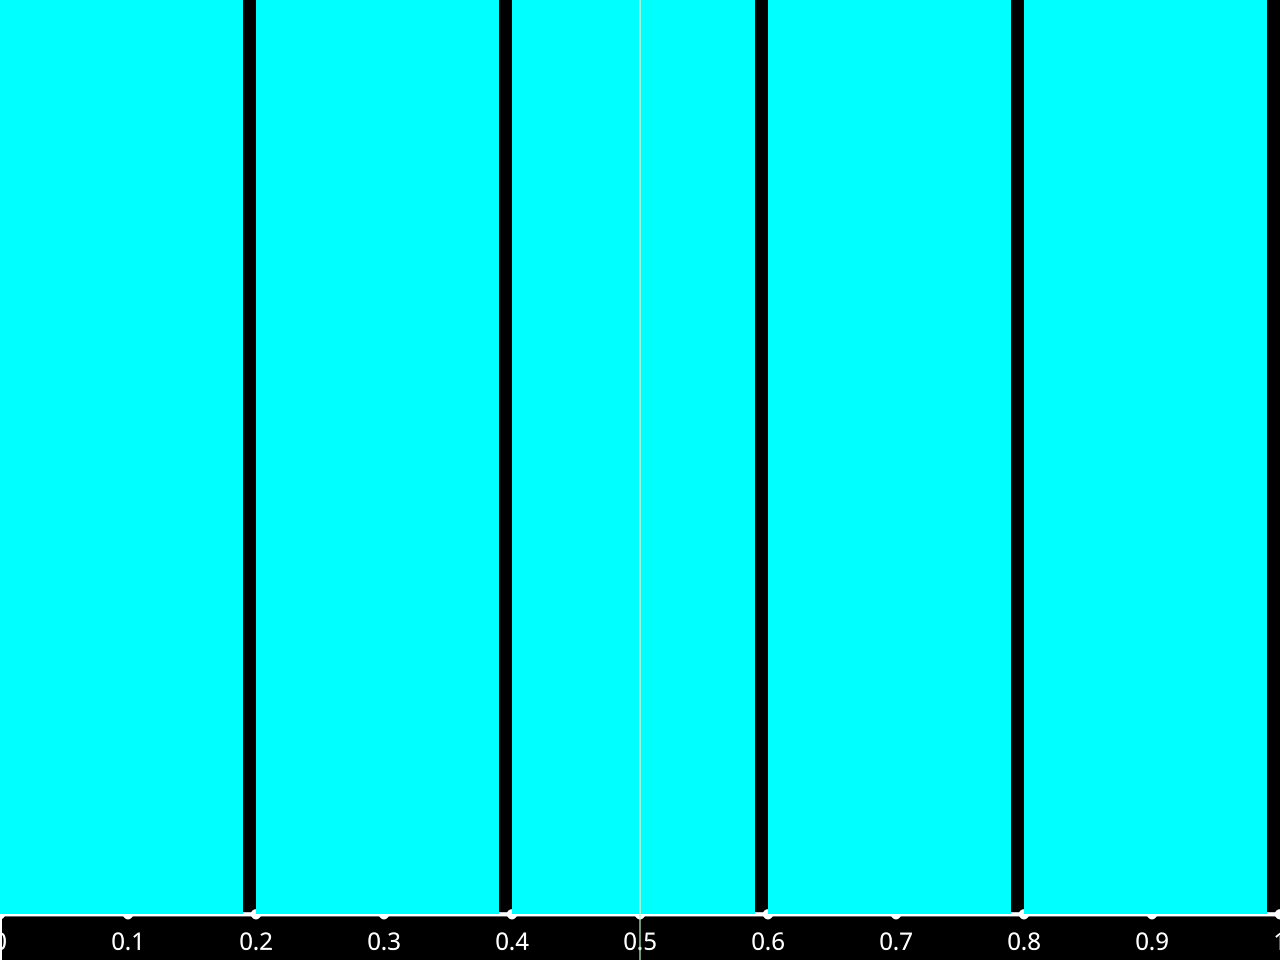
IntervalSet
Ts
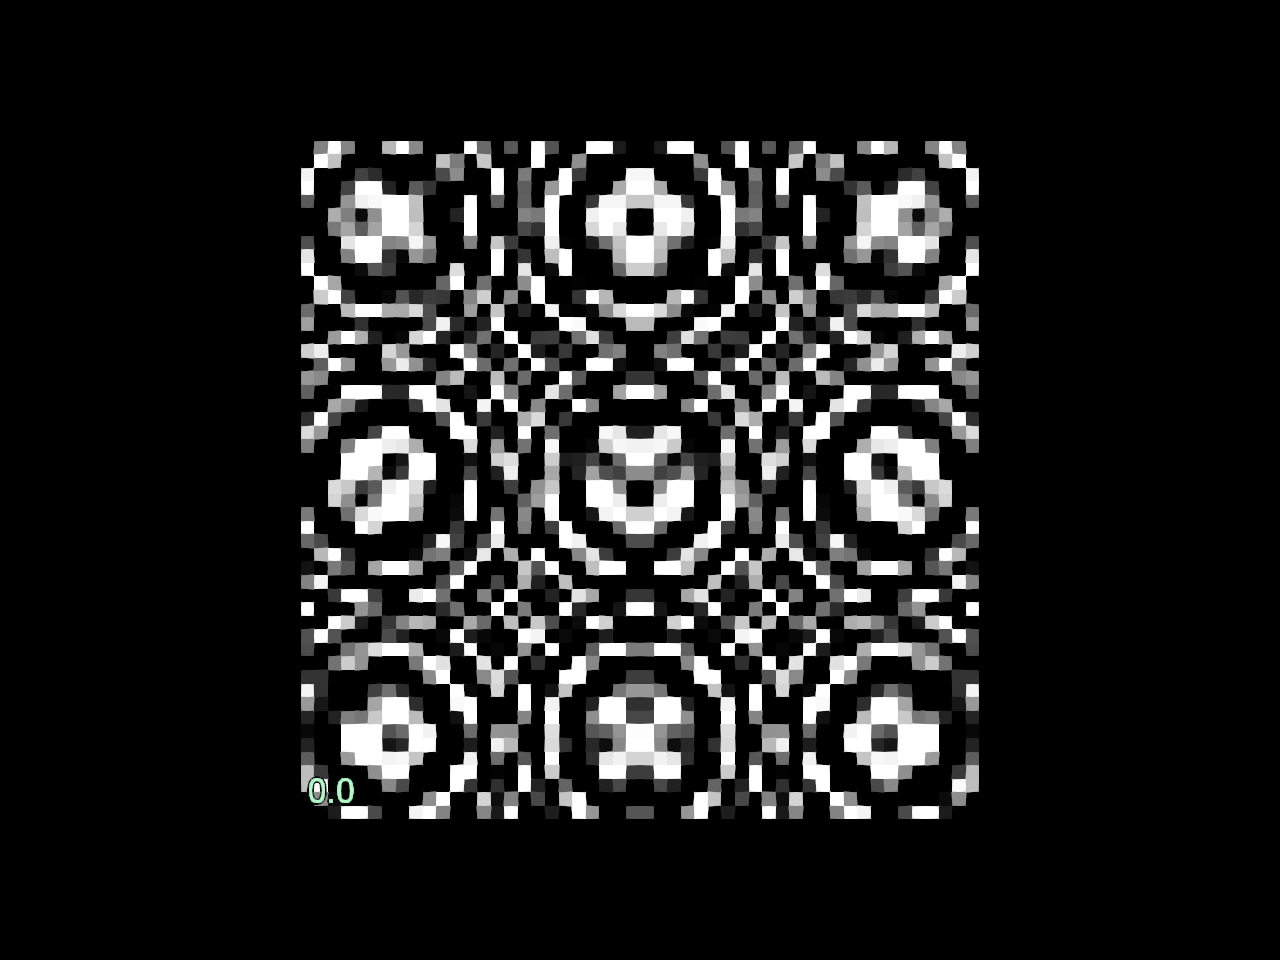
TsdTensor
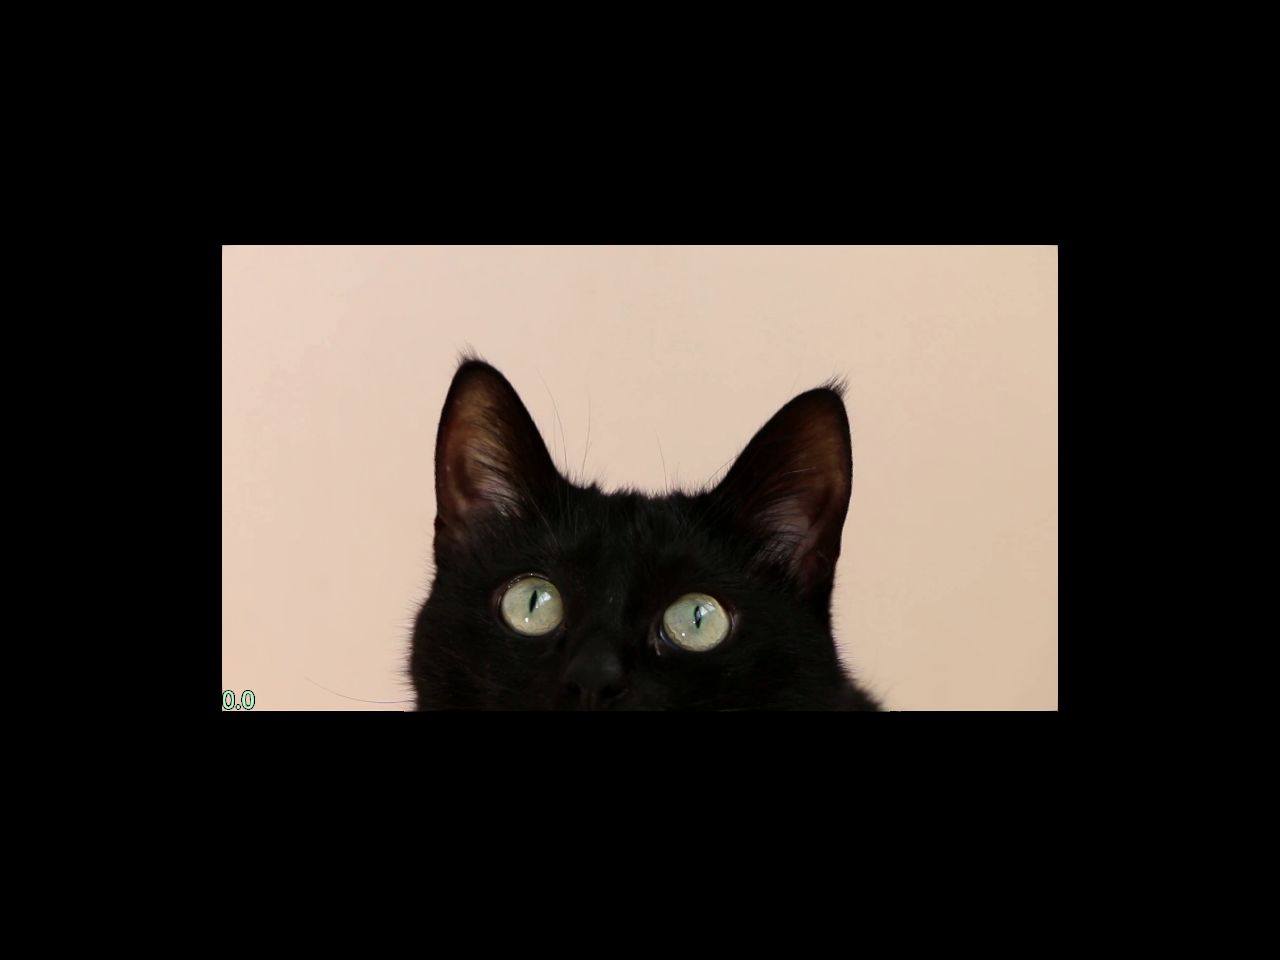
Video handlers#
A video handler is provided to display videos synchronized to time series.
Qt visuals#
Qt widgets wraps the simple visuals with additional interactive functions.